
posted by LPL Financial
Source: LPL Research, Bloomberg 07/01/24 |
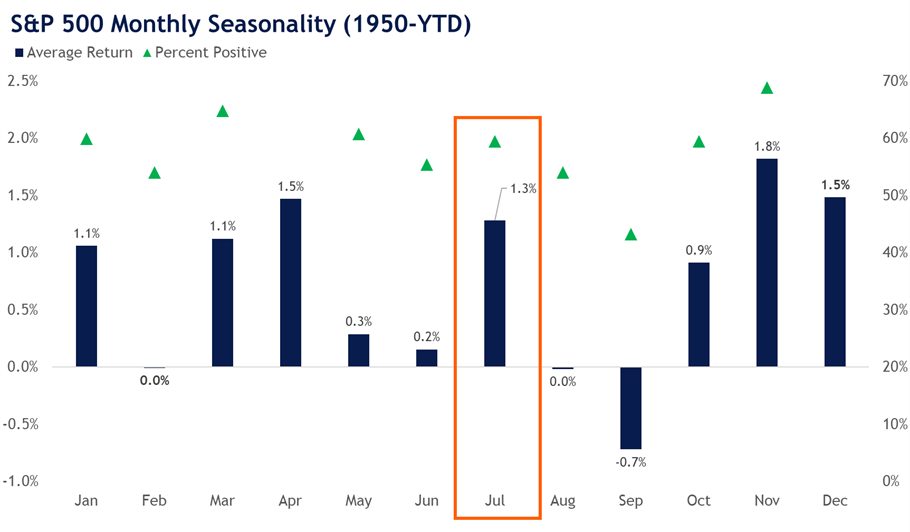
- Today's LPL Financial Chart of the Day highlights the seasonal setup for the S&P 500.
- With June in the rearview, stock market seasonality tends to heat up in July. Since 1950, the S&P 500 has generated an average return of 1.3% during the month and finished higher 60% of the time — not to mention the index has traded higher every July since 2014.
- When the S&P 500 is positive in July, the average return has been 4.0%, as opposed to the average decline of 2.7%.
- At the sector level, real estate and technology have outperformed in July, with respective average gains of 2.7% (since 2002) and 2.1% (since 1990). Energy and utilities have historically underperformed during the month, with average gains of around 0.7% (since 1990).
- For the remainder of the year, the S&P 500 posted an average second-half return of 4.8% and finished higher 71.6% of the time. Furthermore, when first-half gains were 10% or higher, the index posted average gains of 7.7% in the second half, with 83% of occurrences producing positive results.