
Created By: LPL Financial
With just under a month to go until Election Day, 2024 has not been a standard election season, as evidenced by assassination attempts on former President Trump and President Biden stepping down as the Democratic nominee. Even compared to prior cycles, the 2024 U.S. presidential election is likely to be marked by significant uncertainty, exacerbated by recent events and the growing division of policy positions between Democrats and Republicans. Below, we analyze how markets have historically reacted to the presidential cycle and election outcomes.
As well as being a dramatic year politically, this year has been well above average in terms of the magnitude of stock market performance. Directionally, however, it has been typical of a presidential election year — overall positive with a summer dip. If 2024 follows a similar pattern, then we could notice stocks struggle through much of October until much closer to the election. In election years, on average, stocks typically find a bottom from the late summer jitters right around a week before the election.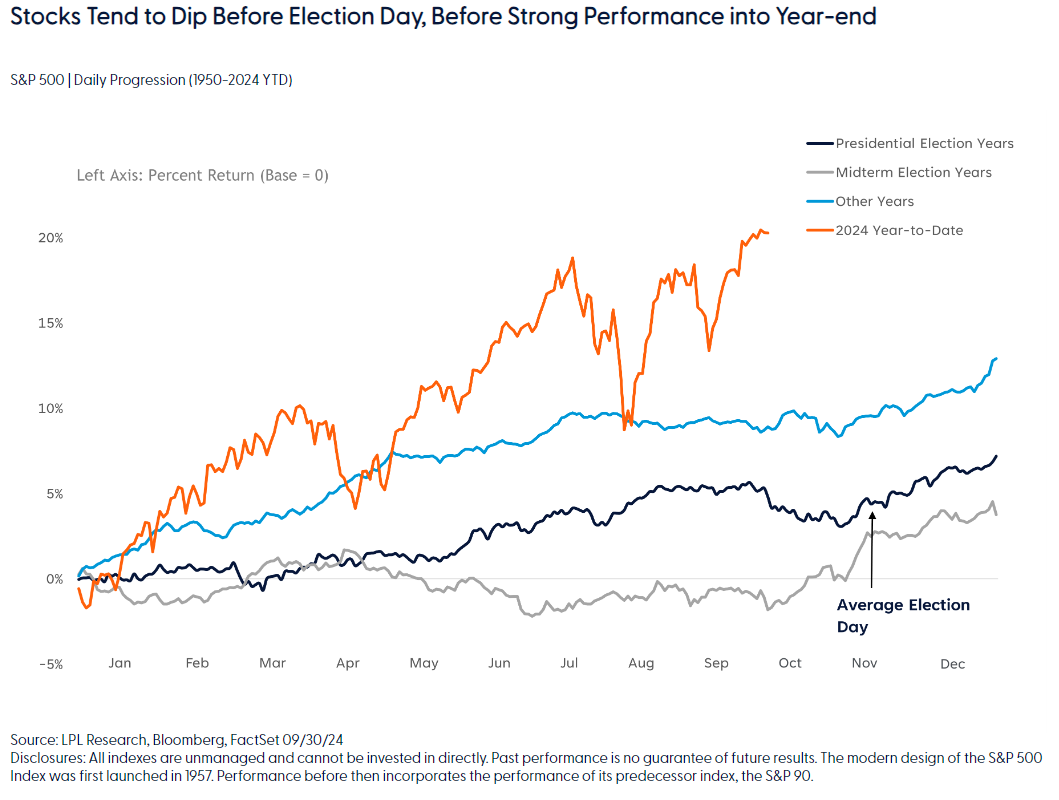
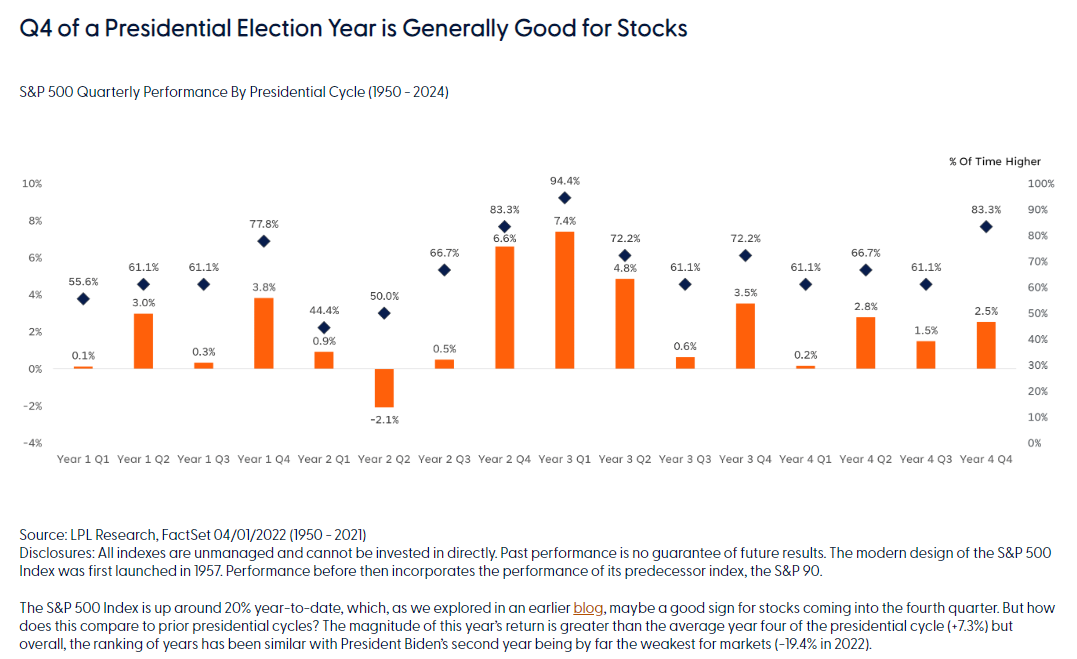
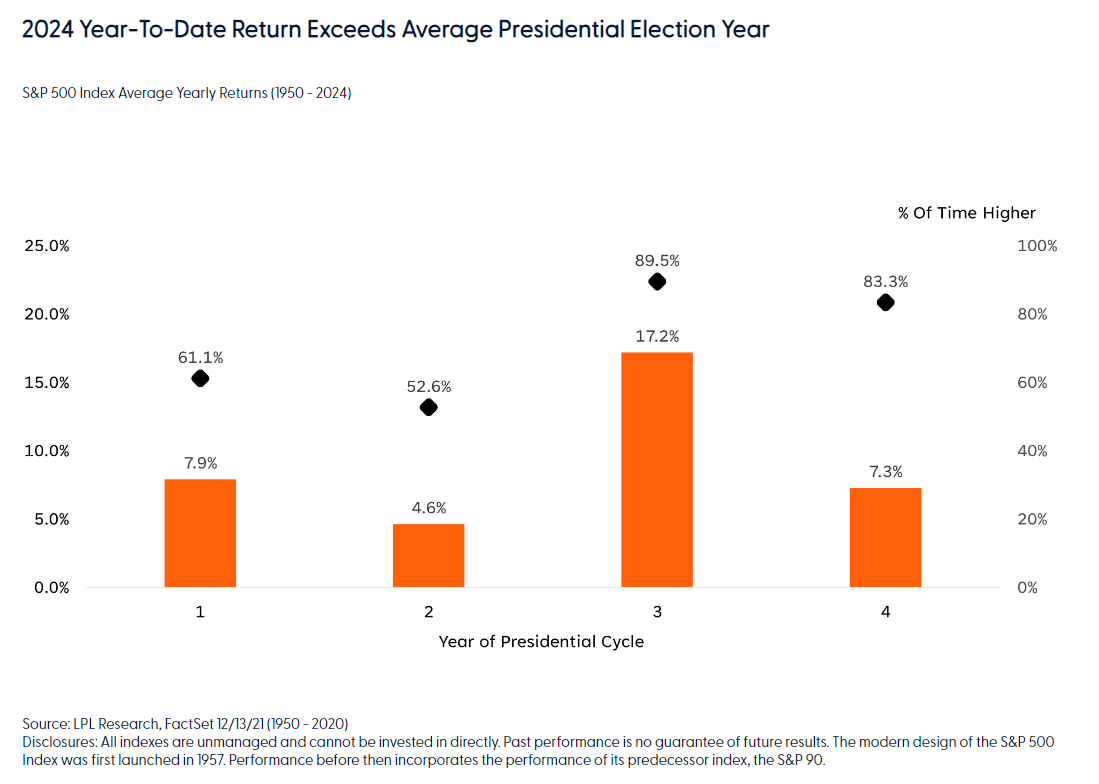
The third quarter of the final year of a presidential cycle is typically a below-average environment for stocks, as markets typically assess each candidate’s policies and chances of success in the upcoming election. Getting through this quarter, especially in a year where the presidential race is so close, with a more than 5% gain for the S&P 500 is well above average (+1.5%). Good news for stock investors is the final quarter of the presidential election cycle has one of the highest proportions of positive returns (83.3%) even if the average returns are more middle of the road (+2.5%). Markets generally react positively to the degree of uncertainty that is removed following the presidential election result, even if the full details of policy in the years to come are still not fully defined.
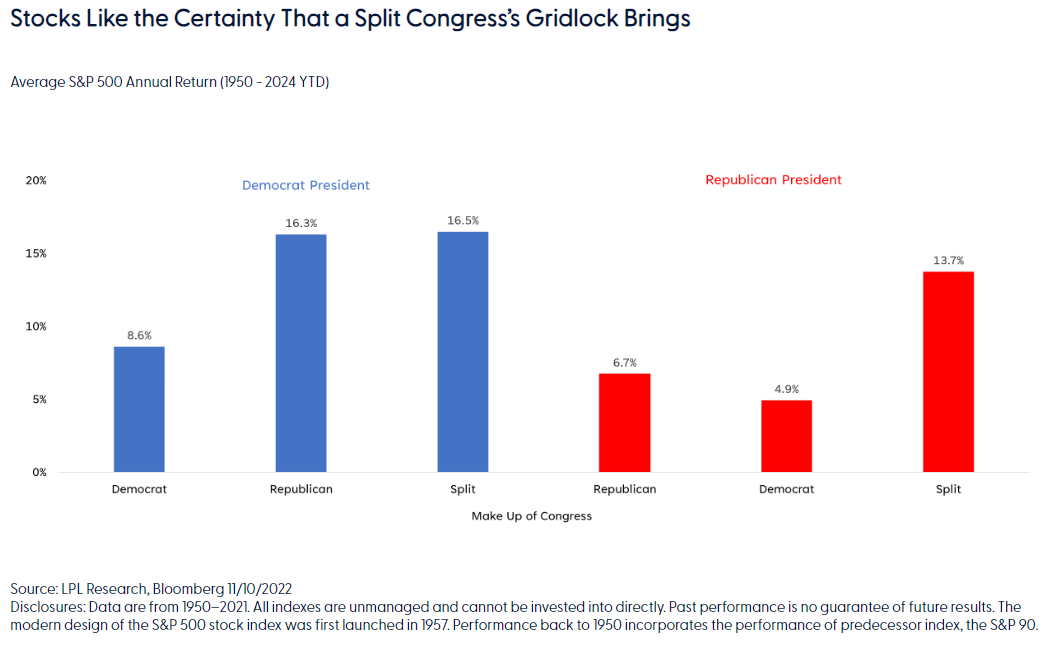
 Much is made of the presidential election and how policies may affect the economy and the stock markets, but some of our favorite charts show that historically markets don’t have a strong preference for one party over the other. Markets like certainty, even if that certainty derives from the status quo amid political gridlock. For this reason, stronger returns tend to happen under a divided government. Most strikingly when looking at Congress alone, average returns when Congress is split are 14.9% compared to just 8% when one party controls both the House and the Senate, underscoring the power of Congress to decide policy. Including the president in the equation, when one party holds the trifecta of president, House of Representatives and the Senate, average returns are closer but still favor power sharing (8% average for the trifecta versus 9.7% for power sharing).
Can Stocks Predict the Election?
As we referenced in our Election Insights Whitepaper 2024, stocks have a good track record of predicting the presidential election result. The S&P 500 return in the three months leading up to the election has correlated with the incumbent party winning 80% of the time since 1928 (the incumbent party wins if stocks are up, and vice versa). Based on this metric along with strong stock market gains since August 5 point to Vice President Harris as the incumbent candidate with four weeks to go.
Additionally, stocks seem to sniff out the potential for change, with stocks down 2.2% in Octobers when the incumbent party loses compared to a 0.8% average gain in October when the incumbent wins. If October is down more than a fraction, the incumbent party has lost eight out of nine times since 1952, with President Obama in 2012 the only incumbent to survive a more than marginally negative October (-2.0%), with stocks being up big through September that year (+14.5%) providing a mitigating tailwind.
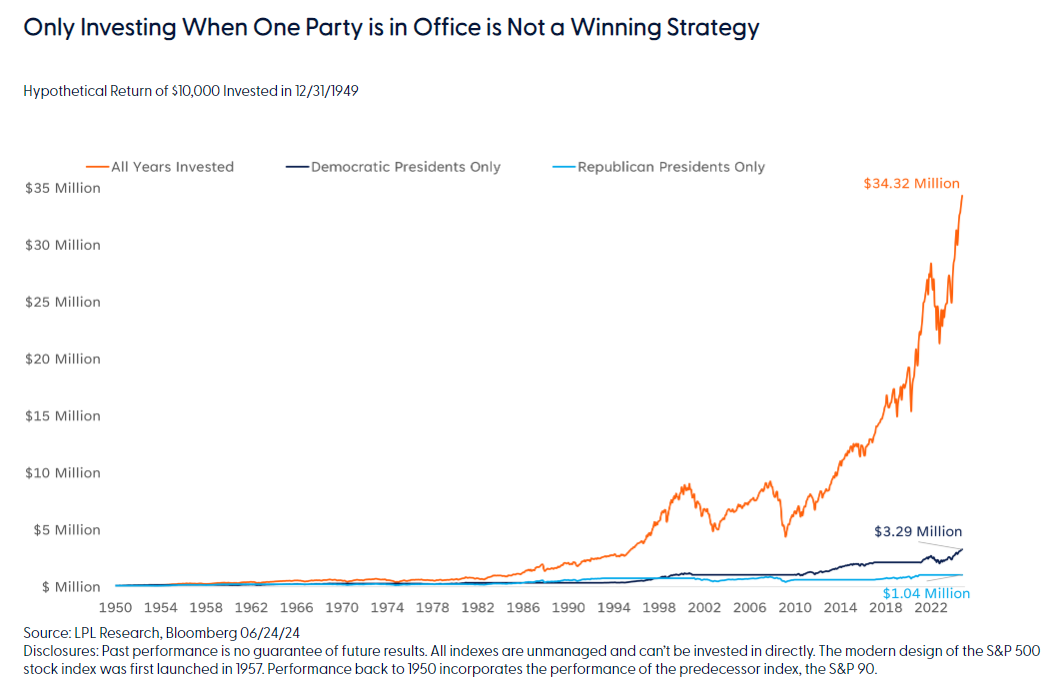
One of our favorite election-related charts illustrates that consistent investing regardless of who is sitting in the White House is a much better strategy than sitting out when either party is in charge. As shown in the prior chart, stocks tend to be positive on average under any political combination, hence the effect of compounding returns really comes into play when considering a strategic time frame. As analyzed below, being out of the market for multiple-year periods for political reasons stifles the long-term returns that a fully allocated stock market investor would have experienced.
Summary
The election is expected to increase short-term market volatility, with historical correlations suggesting potential stock market fluctuations tied to political uncertainty. While differing candidate policies could create specific investment opportunities across areas such as trade, energy and fiscal policy, we believe that bond markets and alternative investments may offer diversification and stability amid policy uncertainty. More strategically, stocks have performed well under presidents from both parties, with political gridlock the preferred outcome.
Important Disclosures
This material is for general information only and is not intended to provide specific advice or recommendations for any individual. There is no assurance that the views or strategies discussed are suitable for all investors. To determine which investment(s) may be appropriate for you, please consult your financial professional prior to investing.
Investing involves risks including possible loss of principal. No investment strategy or risk management technique can guarantee return or eliminate risk.
Indexes are unmanaged and cannot be invested into directly. Index performance is not indicative of the performance of any investment and does not reflect fees, expenses, or sales charges. All performance referenced is historical and is no guarantee of future results.
This material was prepared by LPL Financial, LLC. All information is believed to be from reliable sources; however LPL Financial makes no representation as to its completeness or accuracy.
Unless otherwise stated LPL Financial and the third party persons and firms mentioned are not affiliates of each other and make no representation with respect to each other. Any company names noted herein are for educational purposes only and not an indication of trading intent or a solicitation of their products or services.
Asset Class Disclosures –
International investing involves special risks such as currency fluctuation and political instability and may not be suitable for all investors. These risks are often heightened for investments in emerging markets.
Bonds are subject to market and interest rate risk if sold prior to maturity.
Municipal bonds are subject and market and interest rate risk and potentially capital gains tax if sold prior to maturity. Interest income may be subject to the alternative minimum tax. Municipal bonds are federally tax-free but other state and local taxes may apply.
Preferred stock dividends are paid at the discretion of the issuing company. Preferred stocks are subject to interest rate and credit risk. They may be subject to a call features.
Alternative investments may not be suitable for all investors and involve special risks such as leveraging the investment, potential adverse market forces, regulatory changes and potentially illiquidity. The strategies employed in the management of alternative investments may accelerate the velocity of potential losses.
Mortgage backed securities are subject to credit, default, prepayment, extension, market and interest rate risk.
High yield/junk bonds (grade BB or below) are below investment grade securities, and are subject to higher interest rate, credit, and liquidity risks than those graded BBB and above. They generally should be part of a diversified portfolio for sophisticated investors.
Precious metal investing involves greater fluctuation and potential for losses.
The fast price swings of commodities will result in significant volatility in an investor's holdings.
Securities and advisory services offered through LPL Financial, a registered investment advisor and broker-dealer. Member FINRA/SIPC.
Not Insured by FDIC/NCUA or Any Other Government Agency | Not Bank/Credit Union Deposits or Obligations | Not Bank/Credit Union Guaranteed | May Lose Value
For Public Use – Tracking: #641941